My Blog
Toggle navigation
Financial Analysis
Home
/
Archive by category "Financial Analysis"
( Page4 )
13
Dec
0
Evening Doji
Coming soon…
Admin
Financial Analysis
13
Dec
0
Three Black Crows
Coming soon…
Admin
Financial Analysis
13
Dec
0
Evening Star
Coming soon…
Admin
Financial Analysis
13
Dec
0
Matching High
Coming soon…
Admin
Financial Analysis
13
Dec
0
Doji Star (Bearish)
Coming soon…
Admin
Financial Analysis
13
Dec
0
Harami Cross (Bearish)
Coming soon…
Admin
Financial Analysis
13
Dec
0
Harami (Bearish)
Coming soon…
Admin
Financial Analysis
13
Dec
0
Railway Track (Bearish)
Coming soon…
Admin
Financial Analysis
13
Dec
0
Dark Cloud Cover
Coming soon…
Admin
Financial Analysis
13
Dec
0
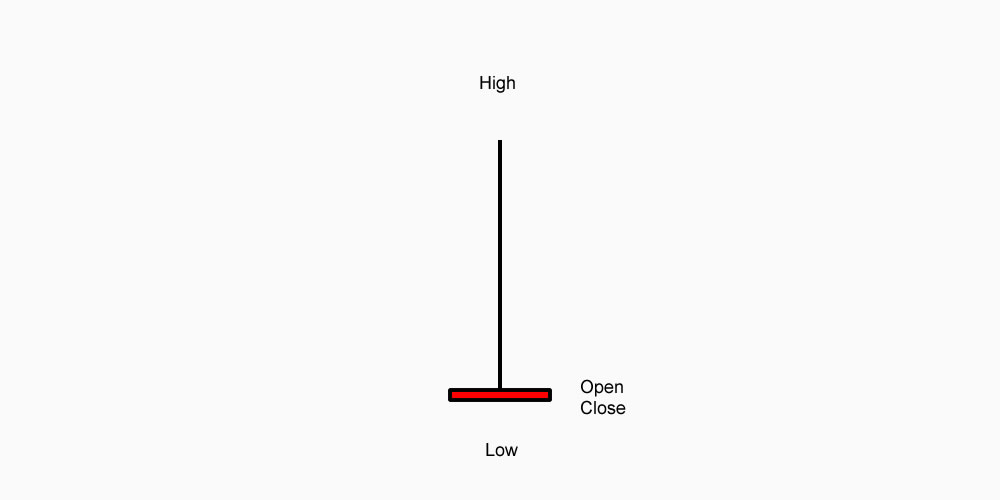
Gravestone Doji
Coming soon…
aaa
Admin
Financial Analysis
1
2
3
4
5
6
7
8
9