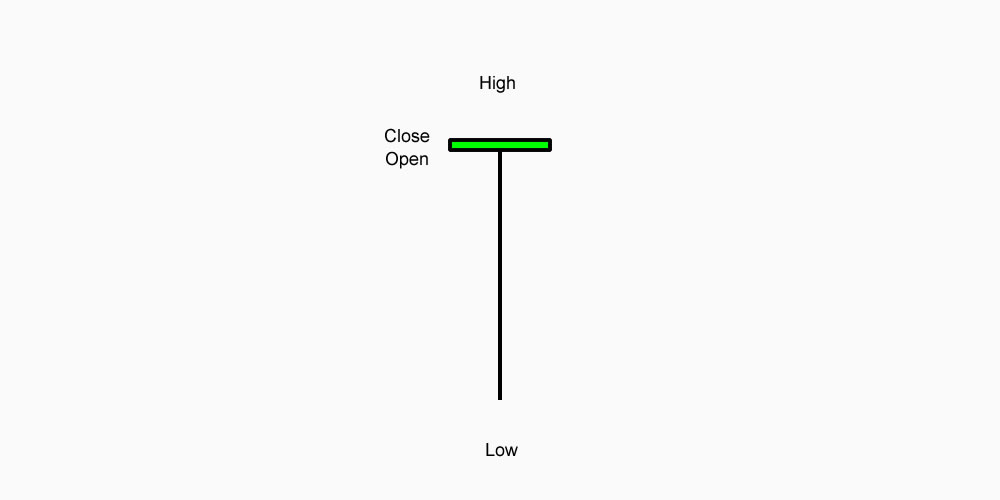
The Inverted Hammer is a candlestick pattern commonly seen in technical analysis, typically at the bottom of a downtrend, indicating potential reversal or a shift in market sentiment. It is a single candlestick pattern with a specific shape and structure, often used by traders to anticipate possible bullish movements. Here’s a detailed breakdown of the Inverted Hammer:
The Inverted Hammer has the following characteristics:
The Inverted Hammer looks similar to the Shooting Star candlestick, but the key difference is their location:
While they share a similar structure, their implications differ based on the prevailing market trend.
Example
Imagine a stock that has been in a downtrend for several weeks. On one particular day, the price opens at $50, moves up to $55, and then closes back at $50. The candle formed would have a small body near the bottom of the candle and a long upper shadow, creating an Inverted Hammer. This suggests that buyers tried to push the price higher, but sellers regained control. If the next day shows a strong bullish candlestick, traders may interpret this as a signal to go long, anticipating the start of an upward trend.
The Inverted Hammer is a useful candlestick pattern that signals potential bullish reversal when it appears at the bottom of a downtrend. It highlights a shift in market sentiment, where buyers begin to show strength despite the prevailing bearish trend. However, for increased reliability, the pattern should be followed by a confirmation of upward movement, and traders should always consider the broader context and other indicators.
Swap derivatives are financial contracts that involve the exchange of cash flows between two parties. These cash flows are typically based on underlying assets such as interest rates, currencies, commodities, or other financial instruments. Swaps are used by businesses, investors, and financial institutions to manage risk, speculate on changes in market conditions, or take advantage of pricing inefficiencies.
Swaps are commonly traded over-the-counter (OTC), which means they are not standardized or traded on an exchange like futures or options. Instead, they are tailored agreements between two parties.
A swap is a financial agreement in which two parties agree to exchange cash flows at specified intervals in the future, based on a pre-determined underlying asset or index. Swaps can be based on a variety of financial instruments, including interest rates, currencies, commodities, or even stock indices.
Unlike forwards or futures contracts, swaps generally do not involve the exchange of the underlying asset itself, but rather the exchange of cash flows. The terms of the swap, such as the notional amount, payment dates, and conditions for each cash flow, are agreed upon by the two parties involved.
Swaps can be classified into several types based on the underlying asset or purpose:
Example:
Example:
Example:
Example:
A swap contract generally consists of several key components:
Swaps are used for a variety of reasons, including:
While swaps offer significant benefits, they come with risks:
Swaps are versatile and complex financial derivatives used primarily for risk management, hedging, and speculative purposes. Whether in the form of interest rate swaps, currency swaps, commodity swaps, or credit default swaps, they allow businesses and investors to exchange future cash flows based on underlying assets or indices. While swaps provide valuable opportunities for customizing risk exposure, they also involve significant risks, especially counterparty risk and market risk. Understanding the mechanics of swaps and their various applications is crucial for anyone involved in advanced financial markets.
Futures derivatives are standardised contracts traded on exchanges that obligate the buyer to purchase, and the seller to sell, an asset at a specified price on a predetermined future date. Futures contracts are widely used in financial markets for hedging risks, speculation, and arbitrage. They allow participants to lock in future prices, potentially profiting from changes in the price of the underlying asset.
Below is a detailed explanation of futures derivatives:
A futures contract is an agreement between two parties to buy or sell an underlying asset (which can be a commodity, financial instrument, or index) at a specified price (called the futures price) at a future date (the maturity date). Futures contracts are standardized agreements, meaning they are traded on exchanges with predetermined terms.
A futures contract includes the following elements:
Futures contracts are typically used for hedging or speculative purposes:
Here’s an example of how a futures contract works:
While futures contracts have many advantages, they come with significant risks, especially when leverage is used:
Futures contracts can be categorized based on the underlying asset:
Futures contracts are traded on futures exchanges such as:
Futures contracts can be settled in one of two ways:
While both futures contracts and forward contracts are agreements to buy or sell an asset at a future date, there are some key differences:
Futures derivatives are powerful financial tools used by businesses, investors, and traders for hedging, speculation, and arbitrage. They offer high liquidity, price transparency, and the ability to manage risk, but they also carry significant risks, particularly when using leverage. Understanding how futures contracts work, the associated risks, and the mechanics of trading these contracts is essential for anyone involved in financial markets.
Forward derivatives, also known as “forward contracts” or “forwards,” are a type of financial instrument used to hedge risk, speculate on price movements, or lock in future prices for assets. These derivatives are private agreements between two parties to buy or sell an asset at a predetermined price on a specified future date.
Here’s a detailed breakdown of forward derivatives:
A forward contract is an agreement between two parties (usually referred to as the “buyer” and the “seller”) to exchange an asset for a specific price at a future date. The contract can be made for various types of underlying assets, such as commodities (oil, gold), currencies, interest rates, or even stock indices.
The forward price is the agreed-upon price for the asset in the contract. It is determined based on the spot price of the underlying asset (the current market price) and factors such as the time until the contract’s expiration, interest rates, and any storage or carrying costs (for physical assets like commodities).
The forward price can be determined using the following formula:
Where:
Let’s say an investor wants to lock in the price of gold, which is currently trading at $1,800 per ounce, for a future date of six months from now. The investor enters into a forward contract with a counterparty (a bank or another investor) to buy 100 ounces of gold at a price of $1,800 per ounce in six months.
Forward contracts are used in various sectors, including:
While forward contracts and futures contracts are similar, they have some key differences:
Forward derivatives are valuable financial instruments used to manage risk, lock in prices, or speculate on price changes. They offer flexibility in terms of contract specifications but also come with increased risks, such as counterparty risk and lack of liquidity. While they are widely used in various industries, understanding the mechanics and risks of forwards is essential for anyone involved in their use.
Bearish reversal
Medium
Occurring during an uptrend, this pattern characterized by a large black real body, which engulfs a white real body (it doesn’t need to engulf the shadows). This signifies that the uptrend has been hurt and the bears may be gaining strength. The Engulfing indicator is also the first two candles of the Three Outside patterns.
It is a major reversal signal.
Factors that are increasing this signal’s reliability:
| Candlestick | Details |
|---|---|
| Pattern: | Hammer |
| Type: | Reversal |
| From: | Downward Trend / Bearish (-) |
| To: | Upward Trend / Bullish (+) |
| Position: | Long (Buy) |
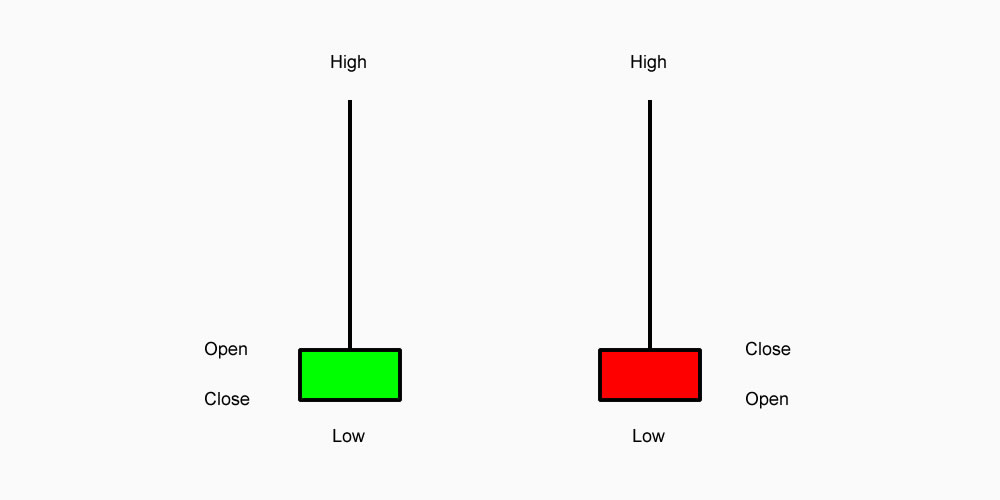
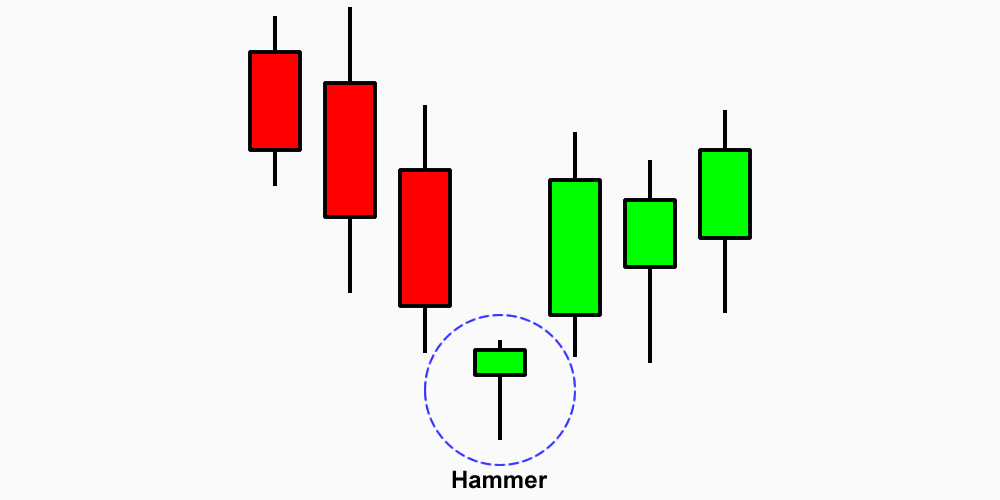
The Hammer candlestick pattern is one of the most well-known reversal patterns in technical analysis. It can signal a potential change in trend direction, particularly when it forms after a downtrend. The Hammer is important because it suggests that the market is attempting to reject lower prices, and it often indicates a shift in market sentiment from bearish to bullish.
The Hammer is a single candlestick pattern that has the following characteristics:
When these conditions are met, it forms the Hammer candlestick. The pattern typically appears at the bottom of a downtrend and can signal a potential reversal or a shift in market sentiment.
Imagine a stock has been in a downtrend, consistently moving lower day by day. On one particular day, the stock opens at $50, falls to $45 during the trading session (forming the long lower shadow), but then rebounds and closes at $49. This forms a Hammer candlestick. The price action shows that, despite initial selling pressure, buyers managed to push the price back up to close nearly where the price opened.
If, the next day, the price opens above $49 and continues to move higher, this would serve as confirmation that the market sentiment may have shifted from bearish to bullish. A trader could then enter a long position, placing a stop loss just below $45 (the low of the Hammer), targeting a return to higher levels.
Understanding the Hammer pattern, along with its nuances, can significantly improve your ability to spot potential reversals and make informed trading decisions.