Profitability
Good for measuring company performance over time. However, not recommended for benchmarking against other company EPS values.
| Region | Country | Index |
|---|---|---|
| Africa | Botswana | BSE DCI - Botswana Stock Exchange Domestic Company Index |
| Africa | Botswana | BSE FCI - Botswana Stock Exchange Foreign Company Index |
| Africa | Egypt | EGX 30 Index |
| Africa | Ghana | GSE All-Share Index |
| Africa | Morocco | MADEX Index (Moroccan Most Active Shares Index) |
| Africa | Morocco | MASI index (Moroccan All Shares Index) |
| Africa | Nigeria | NSE 30 Index |
| Africa | Nigeria | NSE All Share Index |
| Africa | South Africa | JSE - Johannesburg Stock Exchange Domestic Company Index |
| Africa | Zambia | LASI -LuSE All shares Index |
| Africa | Zimbabwe | Zimbabwe Industrial Index |
| Africa | Zimbabwe | Zimbabwe Mining Index |
| Americas | Argentina | MERVAL - 12 Companies |
| Americas | Brazil | IBOVESPA - Bovespa Index |
| Americas | Canada | S&P/TSX 60 |
| Americas | Canada | S&P/TSX Composite Index |
| Americas | Canada | S&P/TSX Venture Composite Index |
| Americas | Chile | IPSA |
| Americas | Colombia | COLCAP |
| Americas | Colombia | IGBC |
| Americas | Haiti | |
| Americas | Jamaica | |
| Americas | Mexico | Indice de Precios y Cotizaciones (IPC) (Bolsa Index) |
| Americas | Peru | SPBLPGPT |
| Americas | Trinidad and Tobago | |
| Americas | United States | Barron's 400 Index |
| Americas | United States | CBOE DJIA BuyWrite Index (BXD) |
| Americas | United States | CBOE NASDAQ-100 BuyWrite Index (BXN) |
| Americas | United States | CBOE NASDAQ-100 Volatility Index (VXN) |
| Americas | United States | CBOE S&P 500 BuyWrite Index (BXM) |
| Americas | United States | CBOE Volatility Index (VIX) |
| Americas | United States | DJIA - Dow Jones Industrial Average |
| Americas | United States | Dow Jones Transportation Average |
| Americas | United States | Dow Jones Utility Average |
| Americas | United States | NASDAQ Composite |
| Americas | United States | NASDAQ-100 |
| Americas | United States | NYSE Arca Major Market Index |
| Americas | United States | Russell 1000 |
| Americas | United States | Russell 2500 |
| Americas | United States | Russell 3000 |
| Americas | United States | Russell MidCap |
| Americas | United States | Russell Small Cap Completeness |
| Americas | United States | Russell Top 200 |
| Americas | United States | S&P 100 |
| Americas | United States | S&P 500 (GSPC, INX, SPX) |
| Americas | United States | S&P Midcap 400 |
| Americas | United States | S&P Midcap 400/BARRA Growth |
| Americas | United States | S&P Midcap 400/BARRA Value |
| Americas | United States | S&P SmallCap 600 |
| Americas | United States | S&P SmallCap 600/BARRA Growth |
| Americas | United States | S&P SmallCap 600/BARRA Value |
| Americas | United States | Wilshire 4500 |
| Americas | United States | Wilshire 5000 |
| Americas | Venezuela | Índice Bursátil Caracas (IBC) |
| Asia | Bangladesh | CASPI |
| Asia | Bangladesh | CSC X |
| Asia | Bangladesh | CSE 30 |
| Asia | Bangladesh | CSE50 |
| Asia | Bangladesh | CSI |
| Asia | Bangladesh | DSE |
| Asia | Bangladesh | DSEX |
| Asia | China | CSI 100 Index |
| Asia | China | CSI 300 Index |
| Asia | China | CSI 300 Index |
| Asia | China | SSE 180 Index |
| Asia | China | SSE 50 Index |
| Asia | China | SSE Composite Index |
| Asia | China | SZSE 100 Index |
| Asia | China | SZSE 200 Index |
| Asia | China | SZSE 300 Index |
| Asia | China | SZSE Component Index |
| Asia | Hong Kong | Hang Seng China Enterprises Index |
| Asia | Hong Kong | Hang Seng China H-Financials Index |
| Asia | Hong Kong | Hang Seng China-Affiliated Corporations Index |
| Asia | Hong Kong | Hang Seng Index |
| Asia | India | Bombay Stock Exchange (BSE) - Sensex |
| Asia | India | National Stock Exchange (NSE) - Nifty50 |
| Asia | India | NIFTY BANK |
| Asia | India | NIFTY MIDCAP 100 |
| Asia | India | NIFTY NEXT 50 |
| Asia | India | NIFTY SMALLCAP 100 |
| Asia | India | S&P BSE 500 |
| Asia | Indonesia | IDX Composite |
| Asia | Indonesia | JII - Jakarta Islamic Index |
| Asia | Indonesia | LQ-45 |
| Asia | Iran | TEPIX |
| Asia | Israel | TA-125 Index (Tel Aviv 125) |
| Asia | Israel | TA-35 Index |
| Asia | Israel | TA-90 |
| Asia | Japan | Nikkei 225 |
| Asia | Jordan | ASE Weighted Index |
| Asia | Kazakhstan | KASE |
| Asia | Malaysia | FTSE Bursa Malaysia Index |
| Asia | Malaysia | Kuala Lumpur Composite Index |
| Asia | Malaysia | MESDAQ |
| Asia | Nepal | NEPSE Index |
| Asia | Oman | MSM-30 |
| Asia | Pakistan | KMI 30 Index |
| Asia | Pakistan | KSE 100 Index |
| Asia | Pakistan | KSE All Share Index |
| Asia | Pakistan | KSE-30 Index |
| Asia | Philippines | PSE All Shares Index |
| Asia | Philippines | PSE Financials Index |
| Asia | Philippines | PSE Mining and Oil Index |
| Asia | Philippines | PSEi - PSE Index |
| Asia | Qatar | DSM-200 |
| Asia | Saudi Arabia | TASI - Tadawul All Share Index |
| Asia | Singapore | STI - Straits Times Index |
| Asia | South Korea | KOSDAQ (for small cap companies) |
| Asia | South Korea | KOSPI |
| Asia | Sri Lanka | All Share Price Index (ASPI) |
| Asia | Sri Lanka | Colombo Stock Exchange Sector indices (CSE Sectors) |
| Asia | Sri Lanka | Milanka Price Index (MPI) - (Discontinued) |
| Asia | Taiwan | TAIEX - Taiwan Capitalization Weighted Stock Index |
| Asia | Thailand | SET Index |
| Asia | Thailand | SET100 Index |
| Asia | Thailand | SET50 Index |
| Asia | Vietnam | CBV Index |
| Asia | Vietnam | S&P Vietnam 10 Index |
| Europe | Austria | ATX |
| Europe | Belgium | BEL20 |
| Europe | Bosnia and Herzegovina | BIRS |
| Europe | Bosnia and Herzegovina | ERS10 |
| Europe | Bosnia and Herzegovina | FIRS |
| Europe | Bulgaria | SOFIX |
| Europe | Croatia | CROBEX |
| Europe | Croatia | CROBIS |
| Europe | Czech Republic | PX Index |
| Europe | Denmark | OMXC20 - OMX Copenhagen 20 |
| Europe | Finland | OMXH25 - OMX Helsinki 25 |
| Europe | France | CAC 40 |
| Europe | France | CAC All Share |
| Europe | France | CAC All-Tradable |
| Europe | France | CAC Large 60 |
| Europe | France | CAC Mid & Small |
| Europe | France | CAC Mid 60 |
| Europe | France | CAC Next 20 |
| Europe | France | CAC Small |
| Europe | France | SBF 120 |
| Europe | Germany | DAX- 30 |
| Europe | Germany | MDAX (Mid Cap) |
| Europe | Germany | SDAX (Small Cap) |
| Europe | Germany | TecDAX |
| Europe | Greece | Athex 20 |
| Europe | Hungary | BUMIX Mid Cap |
| Europe | Hungary | BUX Large Cap |
| Europe | Hungary | Central European Blue Chip Index Regional Large Cap |
| Europe | Iceland | OMX Iceland 15 (Discontinued) |
| Europe | Iceland | OMX Iceland 6 |
| Europe | Ireland | ISEQ 20 |
| Europe | Italy | FTSE Italia Mid Cap |
| Europe | Italy | FTSE MIB |
| Europe | Italy | MIBTel |
| Europe | Lithuania | OMVX - OMX Vilnius |
| Europe | Luxembourg | LuxX Index - Luxembourg Stock Exchange |
| Europe | Netherlands | AEX index |
| Europe | Netherlands | AMX index (Midcap) |
| Europe | Netherlands | AScX index (Small Cap) |
| Europe | Norway | OBX Index |
| Europe | Poland | WIG |
| Europe | Poland | WIG30 |
| Europe | Portugal | PSI-20 |
| Europe | Portugal | PSI-GERAL |
| Europe | Romania | BET-10 |
| Europe | Russia | MICEX - Moscow Interbank Currency Exchange |
| Europe | Russia | RTSI - RTS Index |
| Europe | Serbia | BELEX15 |
| Europe | Serbia | BELEXline |
| Europe | Slovakia | Slovak Share Index |
| Europe | Spain | IBEX 35 |
| Europe | Spain | Madrid Stock Exchange General Index |
| Europe | Sweden | OMXS30 - OMX Stockholm 30 |
| Europe | Sweden | OMXSPI - OMX Stockholm PI |
| Europe | Switzerland | SLI - Swiss Leader Index |
| Europe | Switzerland | SMI - Swiss Market Index |
| Europe | Switzerland | SMI Expanded |
| Europe | Switzerland | SMI MID |
| Europe | Switzerland | SPI - Swiss Performance Index |
| Europe | Ukraine | PFTS Index |
| Europe | United Kingdom | FT30 Index |
| Europe | United Kingdom | FTSE 100 Index |
| Europe | United Kingdom | FTSE 350 Index |
| Europe | United Kingdom | FTSE AIM All-Share Index |
| Europe | United Kingdom | FTSE AIM UK 50 Index |
| Europe | United Kingdom | FTSE All-Share Index |
| Europe | United Kingdom | FTSE Fledgling Index |
| Europe | United Kingdom | FTSE MID 250 Index |
| Europe | United Kingdom | FTSE SmallCap Index |
| Europe | United Kingdom | FTSE techMark Index |
| Global | N/A | Dow Jones Global Titans 50 |
| Global | N/A | FTSE All-World Index Series |
| Global | N/A | MSCI ACWI Index |
| Global | N/A | MSCI World |
| Global | N/A | OTCM QX ADR 30 Index |
| Global | N/A | S&P Global 100 |
| Global | N/A | S&P Global 1200 |
| Global | N/A | The Global Dow - Global Version of the Dow Jones Industrial Average |
| Oceania | Australia | All Ordinaries |
| Oceania | Australia | S&P/ASX 20 |
| Oceania | Australia | S&P/ASX 200 |
| Oceania | Australia | S&P/ASX 300 |
| Oceania | Australia | S&P/ASX 50 |
| Oceania | New Zealand | NZX 50 Index |
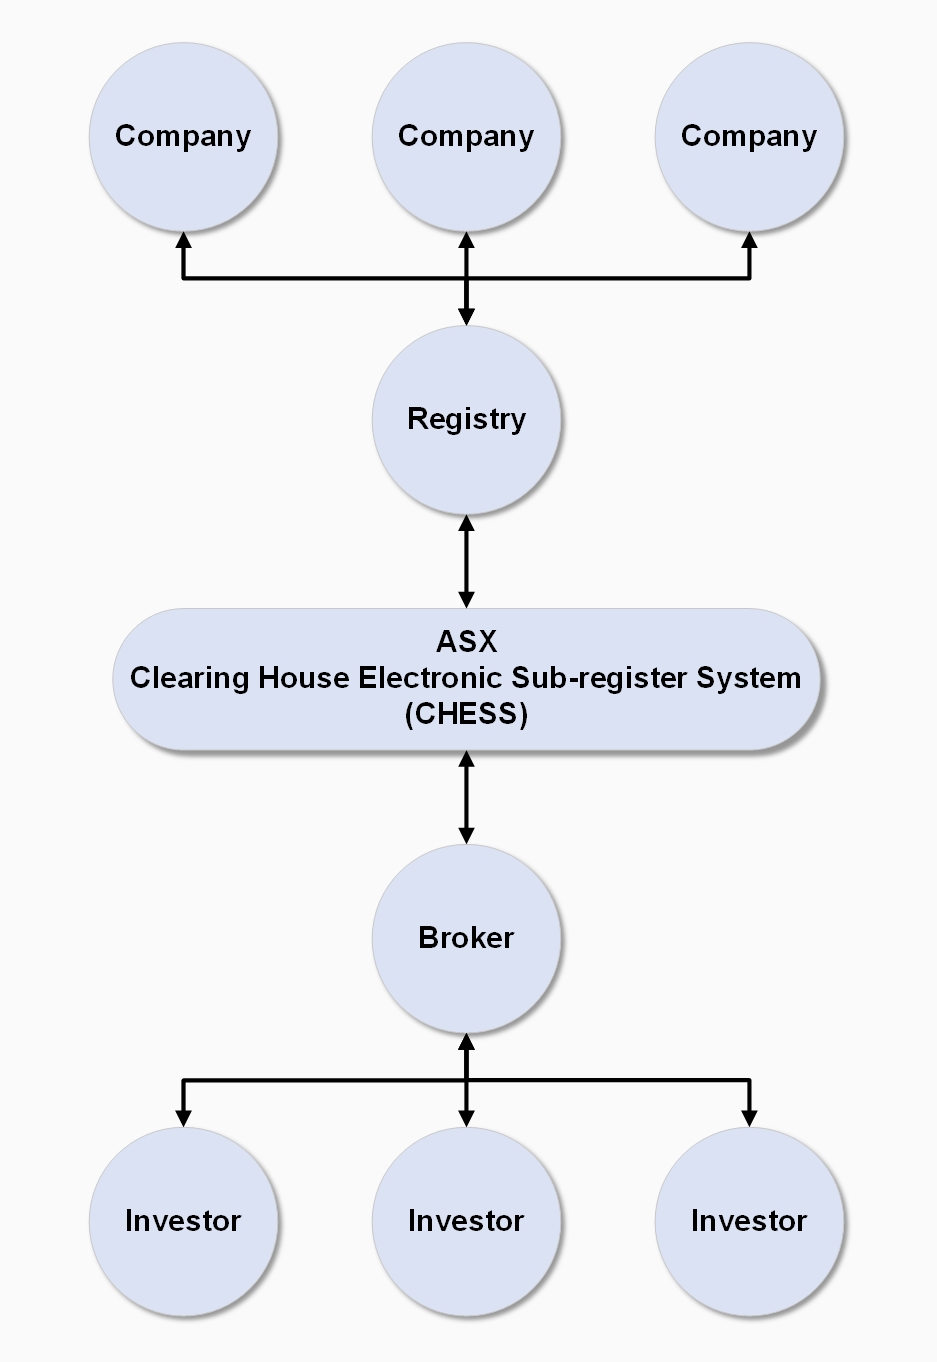
The Clearing House Electronic Sub-register System (CHESS) is an Australian Securities Exchange (ASX) system which facilitates the transfer and settlement of securities between market participants.
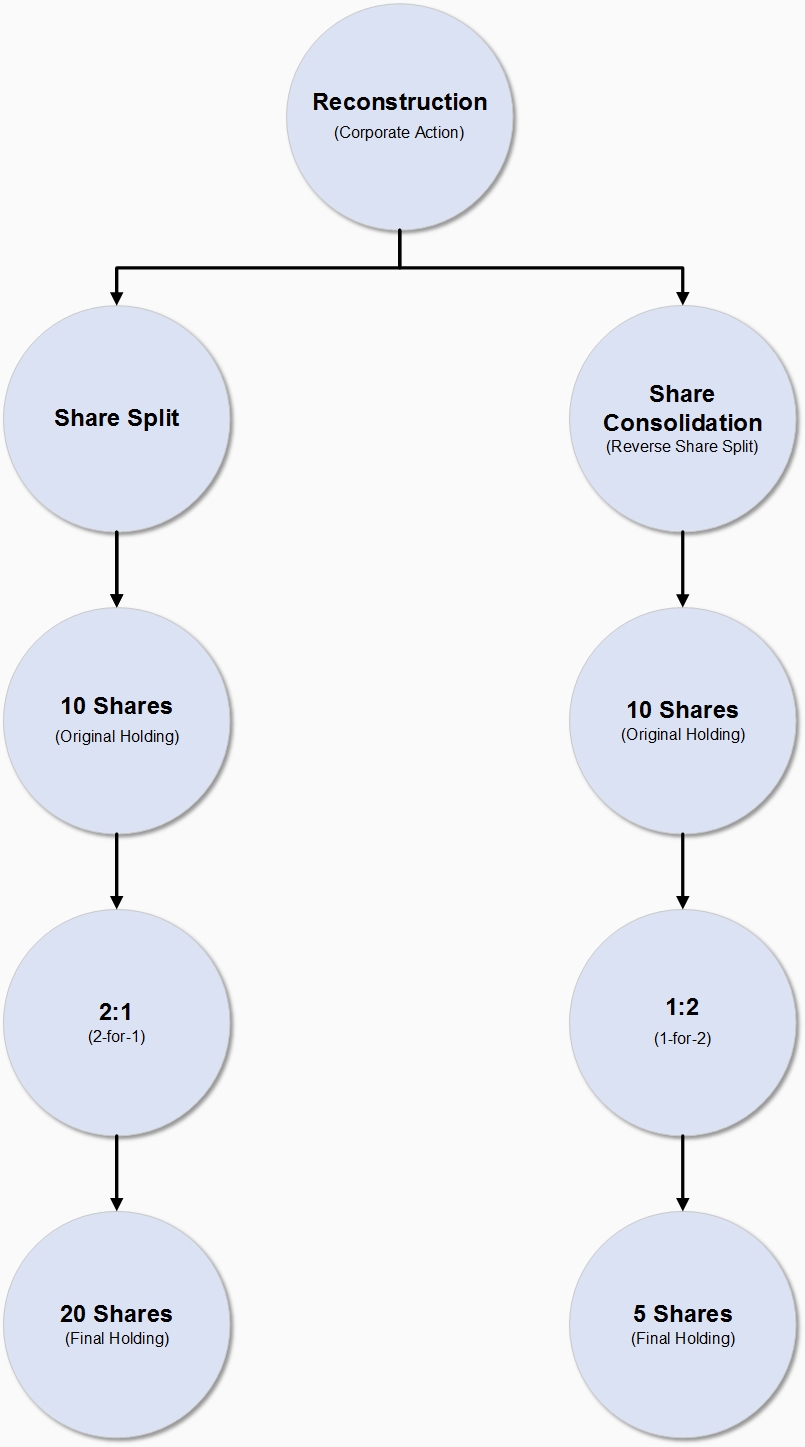
A reconstruction may be a Share Split (increase the number of shares) or Share Consolidation (decrease the number of shares).
If the share price of a company is too high the company may consider splitting the number of shares to ensure the share price is more affordable and liquid in the market.
Any orders present in the market are purged at the end of the trading day prior to the reconstruction.
A share split occurs when a company issues more shares to its existing shareholders, increasing the total number of shares outstanding while maintaining the overall value of the investment. The value of each share is adjusted accordingly, so the total market value of the investment remains the same.
A share consolidation, or reverse stock split, is the opposite of a share split. In this case, a company reduces the number of its outstanding shares by consolidating multiple shares into one. The price per share increases proportionally, so the total value of the investment remains unchanged.
Both actions don’t change the total value of a shareholder’s investment, but they can have significant effects on a company’s stock price and appeal to different types of investors.
Summary: