The Sharpe Ratio is a widely used measure to assess the risk-adjusted return of an investment or portfolio. It helps investors understand how well the return of an asset compensates for the risk taken to achieve that return. The Sharpe Ratio is named after William F. Sharpe, who developed it in 1966.
Purpose
The Sharpe Ratio allows investors to evaluate whether an investment’s returns are due to smart investment decisions or excessive risk-taking. A higher Sharpe Ratio indicates better risk-adjusted returns, meaning the investor is receiving more return per unit of risk. Conversely, a lower Sharpe Ratio suggests that the return isn’t compensating the investor adequately for the level of risk being taken.
Formula
The Sharpe Ratio is calculated as:
Where:
= Sharpe Ratio
= Return of the portfolio or investment (often the expected return or the actual return over a specific period)
= Risk-free rate (the return on a risk-free investment, typically a government bond like U.S. Treasuries)
= Standard deviation of the portfolio’s returns, a measure of risk (volatility)
Breakdown of the Formula
:
- This represents the excess return or risk premium. It’s the return earned by the investment over and above the return on a risk-free asset. The risk-free rate is used as a benchmark, as it represents an investment with no risk. The higher the excess return, the more attractive the investment appears.
:
- This is the standard deviation of the portfolio’s returns, which measures the volatility or risk associated with the investment. A higher standard deviation means greater fluctuations in returns, indicating higher risk. In essence, it tells how spread out the investment’s returns are, with greater variability implying higher risk.
Interpretation
- Sharpe Ratio > 1: The investment is considered to have good risk-adjusted returns. The higher the ratio, the better the risk-return tradeoff.
- Sharpe Ratio = 1: The investment has a moderate risk-adjusted return. It means the return justifies the risk taken.
- Sharpe Ratio < 1: The investment is considered to have poor risk-adjusted returns. The returns are not compensating adequately for the risk.
- Sharpe Ratio = 0: The return is exactly the same as the risk-free rate, so the investor is not earning any additional return for the risk.
- Negative Sharpe Ratio: This suggests that the investment has underperformed the risk-free rate, indicating that the investor would have been better off investing in a risk-free asset.
Example
Let’s say you have the following data:
- Portfolio return (
): 10% (0.10)
- Risk-free rate (
): 2% (0.02)
- Portfolio’s standard deviation (
): 15% (0.15)
The Sharpe Ratio would be calculated as:
This means the Sharpe Ratio for this investment is 0.533, which indicates that the investment provides less return than its risk would ideally warrant (i.e., the risk-adjusted return is moderate).
What Does the Sharpe Ratio Tell You?
- Risk-Adjusted Return: The Sharpe Ratio helps you assess how much return you are getting per unit of risk. In the example above, a ratio of 0.533 means that for each unit of risk, you are getting only a fraction of a unit of return. Investors typically want to see higher ratios, which indicate a more favorable return relative to the risk taken.
- Comparison of Different Investments: The Sharpe Ratio is very useful when comparing different investments or portfolios. It helps investors determine which investment offers the best return for the least amount of risk. For example, an investor might compare two portfolios with similar returns but different risks. The portfolio with the higher Sharpe Ratio would be considered more efficient, as it achieves that return with less risk.
- Performance Evaluation: For portfolio managers or fund managers, the Sharpe Ratio is an important tool for evaluating the performance of a fund. A higher Sharpe Ratio suggests the manager is generating more return relative to the risk they are taking on.
Limitations
- Assumes Normal Distribution of Returns: The Sharpe Ratio assumes that returns are normally distributed (i.e., they follow a bell curve). However, financial returns can be skewed or exhibit “fat tails” (extreme events), making the Sharpe Ratio less reliable during periods of market stress or unusual events.
- Does Not Account for All Risks: The Sharpe Ratio mainly focuses on volatility as a measure of risk, but it doesn’t account for other types of risks like liquidity risk, credit risk, or event risk. Therefore, it may not give a complete picture of an investment’s risk profile.
- Doesn’t Handle Negative Returns Well: If an investment has consistently negative returns, the Sharpe Ratio can become misleading, as it might suggest a positive risk-adjusted return even though the investor is losing money.
- Risk-Free Rate Assumption: The choice of the risk-free rate is subjective and can affect the Sharpe Ratio. For example, using U.S. Treasury bonds as the risk-free asset may not be appropriate in all countries or scenarios.
Sharpe Ratio vs. Other Risk-Adjusted Return Metrics
- Sortino Ratio: Unlike the Sharpe Ratio, which uses total volatility, the Sortino Ratio only considers downside volatility (the risk of negative returns). This makes it more useful when an investor is concerned only about the risk of losses.
- Treynor Ratio: The Treynor Ratio is similar to the Sharpe Ratio but uses beta (a measure of market risk) instead of standard deviation. It focuses on how well a portfolio performs relative to its exposure to systematic (market) risk rather than total volatility.
Conclusion
The Sharpe Ratio is a valuable tool for investors to assess the return on an investment relative to the risk taken. A higher Sharpe Ratio indicates a more favorable risk-adjusted return, while a lower ratio suggests the investment is not compensating adequately for the risk. However, it’s important to be aware of its limitations and use it in conjunction with other metrics to get a more complete picture of an investment’s risk and return characteristics.
Formula
$$\begin{aligned} Sharpe\;Ratio &= \left[ Expected\;Return\;-\;Risk\;Free\;Rate\over Standard\;Deviation\;of\;Excess\;Return \right] \\\\\\\ &= \left[ Risk\;Premium\over Standard\;Deviation\;of\;Excess\;Return \right] \\\\\\\ &= \left [E(r_i)\;-\;r_f \over \sigma_i \right]\end{aligned}$$
Graph
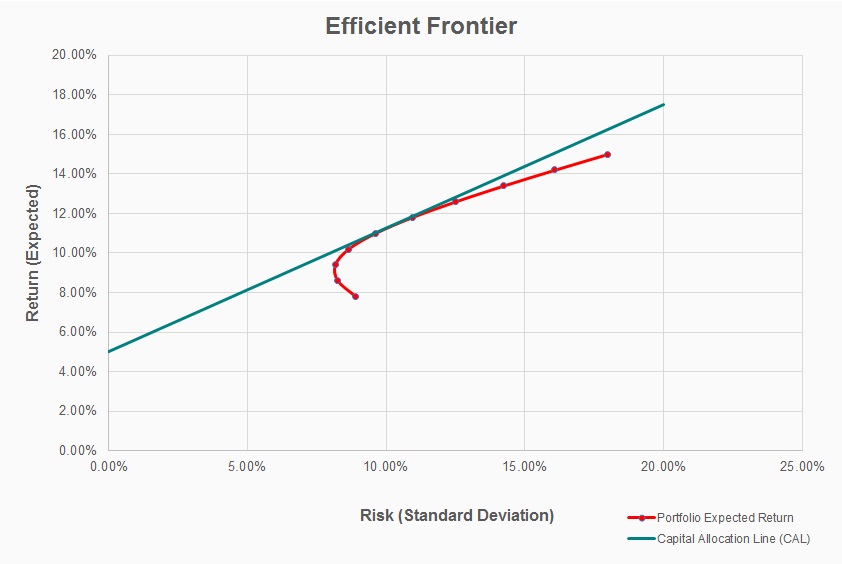
Sharpe Ratio
Sharpe Ratio
